
Melanoma U.S. Mortality Trends
Alternative Ways of Characterizing Trends in Melanoma Mortality Using Joinpoint-CR and Joinpoint-Jump Models
In general, for causes of death with comparability ratios less than a certain threshold (e.g. between 0.99 and 1.01) the standard Joinpoint model may be sufficient.
Melanoma is one of the cancer sites that have a relatively large comparability ratio from ICD-9 to ICD-10 coding change. The published ICD-9 to ICD-10 comparability ratio is 0.9677 (SE = 0.0032, 95% CI = (0.9614, 0.9741)), indicating a drop of 3.3%, i.e, {(1/.9677) – 1 )x 100% } between 1998 and 1999. In addition to the standard Joinpoint model, both JP-CR and JP-Jump models are applied to find the trend for the Melanoma mortality. The following illustrates how the final model is decided among the three models.
Selected Model
For causes of death with comparability thresholds less than 0.99 or greater than 1.01 the following criteria are provided to choose between the Comparability Ratio (CR) model and Jump model, and have been used to select the model of choice for melanoma trends.
- If the underlying cohort size is small, the comparability ratio estimated using the Jump model can be quite variable. Therefore, as a first step, if the statistical test that the comparability ratio from the Jump model indicates that the CR estimate is not statistically different than 1, use the CR model. However, if the comparability ratio provided by a double coding study (and directly input into the CR model) is also not statistically different than 1, then use the standard Joinpoint model.
- Even in situations where the jump is statistically significant, if there is large variability, and the comparability ratio is small, one should be wary of estimates of the comparability ratio estimated from the Jump model which differ widely from the comparability ratio estimated using a double coding study and input into the CR model. The underlying variability of the data may make estimation of a small or modest jump size impossible, and there may be confounding between the estimation of the size of the APC, the location of the joinpoints, and the size of the jump. In small subpopulations (e.g. API, AI/AN, rare cancer sites, or small geographic areas), such situations may occur. To avoid this, if the cohort size represents less than some threshold (we utilized 5000 deaths per year as a cutoff) then the CR model should be used rather than the Jump model.
The example below demonstrates one of the situations.
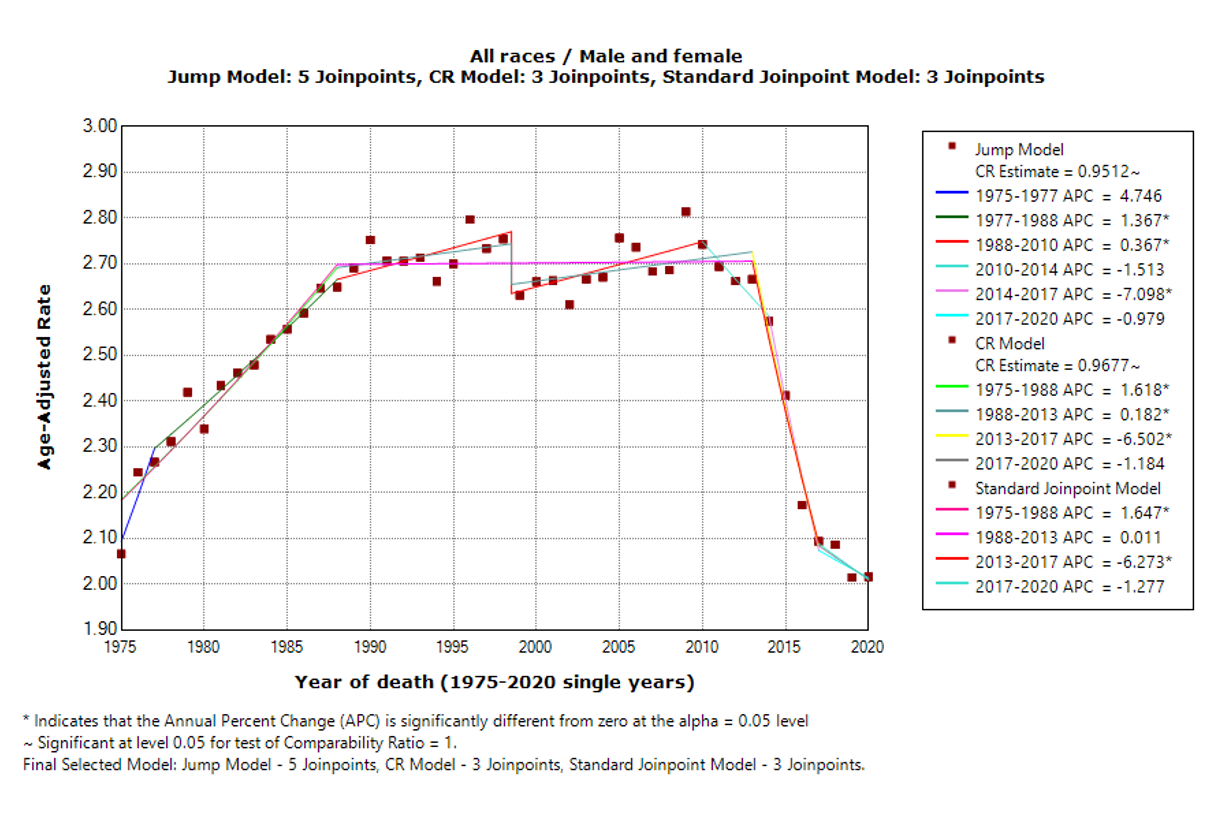
Figure 1 shows the three models for the same cohort (U.S. Melanoma mortality, both sexes, all races) but for a longer series, 1975-2020. The standard Joinpoint model now shows three joinpoints, the Jump model shows five joinpoints, and the CR model shows three joinpoints. For trend analysis, the last segment tends to draw the most interest for its important indication on the most recent trend. All three models show a downward trend in the last segment: APC for the Jump model, CR model and standard Joinpoint model are -0.98 (not statistically significant), -1.18 (not statistically significant), and -1.27 (not statistically significant), respectively. The standard Joinpoint model has a level trend between 1988 and 2013 (APC= 0.01, not statistically significant) and then a downward trend between 2013 and 2017 (APC= -6.27, statistically significant). On the other hand, both Jump model and CR model show upward trend for the majority part of this period: between 1988 and 2013, CR model has APC = 0.18 (statistically significant) and between 1988 and 2010, Jump model has an APC of 0.37 (statistically significant). In this example, the CR estimated from the Jump model is 0.9677, and a statistical test shows that the CR is significantly different from one. The 2020 death counts for this cohort is 8214, which is larger than 5000. Using the criteria mentioned earlier, the Jump model is selected as the final model.
Figure 1. Standard Joinpoint model, Jump model, and Comparability Ratio model for all races and both genders US Mortality for Melanoma, 1975-2020. The estimate of the comparability ratio from the Jump model is 0.9512 with standard error = 0.0114 (the estimate of the comparability ratio is statistically different than 1). The comparability ratio (input from a double coding study) is 0.9677 with standard error = 0.0032 (the estimate of the comparability ratio is statistically different than 1).
Alternate Tables
Based on the model selection criteria described above, an alternate table of US melanoma mortality results that corresponds to the mortality portion of Melanoma from SEER*Explorer has been computed. The alternate table shows the results of the three joinpoint models for US mortality from 1975-2020 by gender and racial groups. The default maximum joinpoints allowed for 1975-2020 series are five joinpoints. In these tables the preferred model is indicated for each cohort. The standard Joinpoint model is the one currently in use in the SEER*Explorer.