
Overview of the Jump and Comparability Ratio Models
The Jump model and Comparability Ratio (CR) model in the Joinpoint software provide a direct estimation of trend data (e.g. cancer rates) where there is a coding or other type of scale change, which causes a "jump" in the rates, but is assumed not to affect the underlying trend.
While some causes of death other than cancer have large ICD-9/ICD-10 coding changes, most cancer causes of death have relatively small comparability ratios (a measure of the ratio of the number of death certificates coded to a specific cause under the ICD-10 divided by the number coded to that cause under ICD-9). All the cancer sites published in SEER*Explorer have comparability ratios that fall between 0.99 and 1.01 except for 10 cancer sites (Table 1).
| Site | CR | SE(CR) |
|---|---|---|
| Oral Cavity and Pharynx | 0.9603 | 0.0040 |
| Liver and Intrahepatic Bile Duct | 0.9634 | 0.0023 |
| Lung and Bronchus | 0.9837 | 0.0005 |
| Melanoma of the Skin | 0.9677 | 0.0032 |
| Corpus and Uterus NOS | 1.026 | 0.0040 |
| Prostate | 1.0134 | 0.0015 |
| Brain and Other Nervous System | 0.9691 | 0.0025 |
| Non-Hodgkin Lymphoma | 0.9781 | 0.0018 |
| Leukemia | 1.0119 | 0.0019 |
| Myeloma | 1.0383 | 0.0030 |
For many of these cancer sites, the comparability ratio is too small to impact the trends in any meaningful way. However, it is possible that a relatively modest comparability ratio can change the overall conclusions about the trends.
Models
The jump model and comparability ratio model in the Joinpoint software provide a direct estimation of trend data (e.g. cancer rates) where there is a coding change, which causes a "jump" in the rates, but is assumed not to affect the underlying trend. The user supplies the location of the last data point before the coding change occurs. The software automatically locates the discontinuity or "jump" halfway between this last data point and the next one. The software currently only allows for a single "jump". For example, the ICD coding changes (Anderson et al. 2001) from ICD-9 to ICD-10 for classification rules for selecting underlying causes of death. The last year that ICD-9 was used was 1998, and ICD-10 was implemented starting in 1999. If the user had entered annual data, they would enter 1998, and the software would place the "jump" at 1998.5.
There are two different options for how a model can be implemented to allow for a coding change:
Comparability Ratio Model: In some cases a "double coding" study has been conducted, where a certain number of cases have been coded under both the old and new systems. In such cases a "comparability ratio" and its standard error can be externally entered, where the comparability ratio is defined as:
For example, the National Center for Health Statistics (NCHS) maintains a web page on comparability ratios derived from double coding studies, and has a report (Anderson et al. (PDF)) which contains the comparability ratios and associated standard errors for a long list of underlying causes of death. In other cases (for example, changes in how stage of disease is coded for cancer), there may be a number of years where both staging systems were used simultaneously, and the comparability ratio can be derived from these years of overlap. In the comparability ratio model, the data before the jump is multiplied by the comparability ratio (and new standard errors are computed using the delta method utilizing both the standard error of the data point and the standard error of the comparability ratio). The new series is fit using a standard joinpoint model, and the transformed data points and fitted values are transformed back to the original coding (by dividing by the comparability ratio) prior to graphing.
Jump Model: In other situations, there may be no "double coding" studies available. In these situations, the "jump" is a parameter in the model (rather than entered externally) and is estimated directly. It is the underlying assumption of this model (i.e. that the same trend continues before and after the jump) that allows this type of model to be estimated. For the jump model, the user only has to enter the location of the last data point before the coding change occurs. The model can be described as below. For y = log r, where r is the rate at a given time, and χ is the time, assume:
yi = log(ri) = βo + β1xi + δ1(xi - τ1)+ + ... + δK(xi - τK)+ + γI(xi ≥ s) + εi
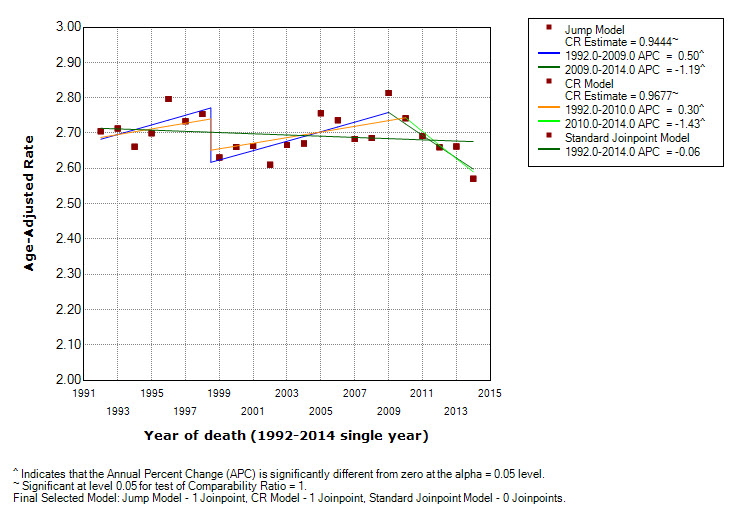
where τ's are unknown change-points, s is the known location of the coding change, εi are independent errors, the symbol a+ represents the a for a>0 and 0 if a≤0, I is an indicator function equaling to 1 if the condition is satisfied, β’s, δ’s, τ's and γ are the model parameters to be estimated. The parameter γ represents the jump and exp(γ) represents the ratio of rates coded under the new coding scheme divided by rates coded under the old coding scheme (i.e. the comparability ratio estimated from the jump model). An example is provided to demonstrate how incorporating a coding change (even one that is relatively modest) can change the overall conclusions about the trends. For melanoma, the published ICD-9 to ICD-10 comparability ratio is 0.9677 (SE = 0.0032, 95% CI (0.9614, 0.9741)). Figure 1 shows US melanoma mortality for all races and both genders from 1992 through 2014 using the standard joinpoint model, the comparability ratio model, and the jump model. The standard joinpoint model found no joinpoints, and shows a flat trend with a non-significant APC of -0.06% per year. A comparability ratio less than one (i.e. 0.9677) forces a sudden drop in the trend line between 1998 and 1999. With this shift, the comparability ratio model shows a joinpoint in 2010 with a significant rise of 0.30% per year prior to 2010 and a significant fall from 2010 to 2014 of 1.43% per year. The jump model estimates a similar comparability ratio of 0.9444, and finds a joinpoint at 2009 with a significant rise of 0.50% per year prior to the joinpoint, and a significant decline of 1.19% after. These are qualitatively different results when the coding change from ICD-9 to ICD-10 is taken into account.
Motivated by this example, the complete set of US melanoma mortality results in NCI’s Cancer Statistics Review, with results from the standard joinpoint model, jump model and comparability ratio model, can be found on the Melanoma example.
Figure 1. Standard joinpoint model, jump model, and comparability ratio model for all races and both genders US mortality for melanoma, 1992-2014. The estimate of the comparability ratio estimated from the jump model is 0.9444 with standard error = 0.0116 (the estimate of the comparability ratio is statistically different than 1). The comparability ratio (input from a double coding study) is 0.9677 with standard error = 0.0032 (the comparability ratio is statistically different than 1).
Input Parameters
- For the jump model, the user supplies:
- The location where the coding changes start to occur.
- All other parameters set in the standard joinpoint regression model such as minimum and maximum number of joinpoints, permutation methods, etc.
- For the comparability ratio model, the user supplies:
- The location where the coding changes start to occur.
- The size of the comparability ratio. The ratio is limited to [0.01, 100].
- The variance of the comparability ratio. The variance is limited to [0, 100]. If you use the homoscedastic error option for Joinpoint (i.e. no standard errors) the variance of the comparability ratio will be set to "NA" (not applicable) and will not be able to be changed. If the heteroscedastic error option is used, the user may enter zero if they do not have an estimate of the variance of the comparability ratio, but they are encouraged to enter the variance if they have one. All other parameters set in the standard joinpoint regression model such as minimum and maximum number of joinpoints, permutation methods, etc.
- Restrictions:
- The jump point must be 4 or more data points from either end of the data.
- The jump and comparability ratio models can only be run with the Grid Search method.
- The jump and comparability ratio models can only be run when the Log Transformation is set to Yes.
Output
- Both the jump and comparability ratio models will output all the items/statistics produced by the standard joinpoint model.
- The jump model will produce additional statistics related to the jump value and also provide an estimate of the comparability ratio: comparability ratio = exp(jump value). While in almost all situations the comparability ratio and the jump values should both be either statistically different from 0 and 1 respectively (since they are related by a transformation), occasionally, the comparability ratio and jump value do not show the same statistical significance. This minor discrepancy rarely happens. It is due to an approximation from the delta method applied to finding the confidence interval of the comparability ratio of the jump model.
Which model to use?
Considerations of which model to use could include:
- No "double coding" study may be available, in which case the jump model is the only option.
- The "double coding" study on which the comparability ratio is estimated usually is conducted using data from calendar years close to when the coding change occurred. However, the actual ratio may vary as one gets further from the year the coding change occurred. The jump model implicitly uses all of the years before and after the coding change to estimate a best fitting jump.
- The population for which the "double coding" study was conducted may differ from the population for your data series (e.g. the double coding study may have been conducted for all races and your data series may be for blacks, or the double coding study may have been conducted in one cancer registry, but the data series is for a different registry). The jump model has some advantages in this case because it is estimated directly using the data series of interest.
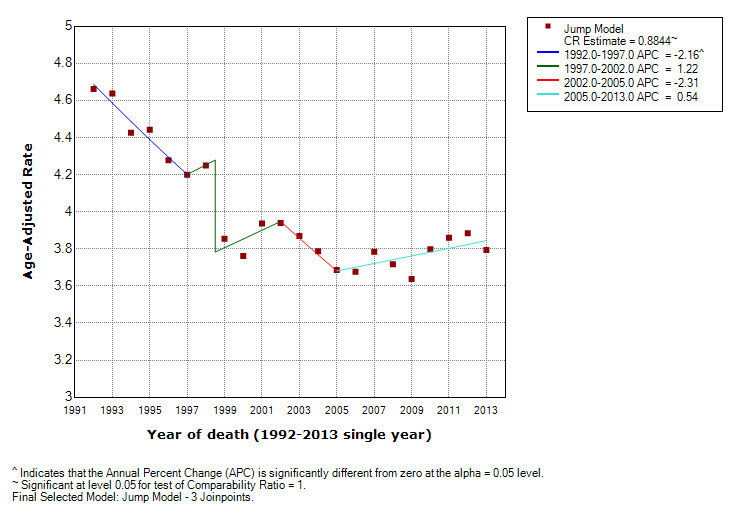
- A joinpoint may be close to the location of the jump. In this case, the estimate of the size of the "jump" in the jump model may be partially confounded with the slope before and after the joinpoint. For example, a series for non-Hispanic white males for oral cavity and pharynx cancer mortality is shown in Figures 2 thru 4. The Standard Joinpoint model is shown in Figure 2 and displays an annual percent change (APC) of -1.77% from 1992 through 2005 and a non-statistically significant APC of 0.63% from 2005 to 2013. The comparability ratio (estimated from a double coding study) is 0.9603 and shows an APC of -1.36% from 1992 through 2005, and a non-statistically significant APC of 0.53% from 2005 to 2013 (Figure 3). The Jump model (Figure 4) estimated a comparability ratio of 0.8844 which is further from the null value of 1 as compared to the value from the comparability ratio model (0.9603). An examination of this model shows a joinpoint at 1997 which is very close to the coding change at 1998.5. The upward APC segment from 1997 through 2002 is only made possible by the large compensating downward jump, and appears to be a spurious result.
Figure 2. Standard joinpoint model for White non-Hispanic Male US Mortality for Oral Cavity and Pharynx Cancers, 1992-2013.
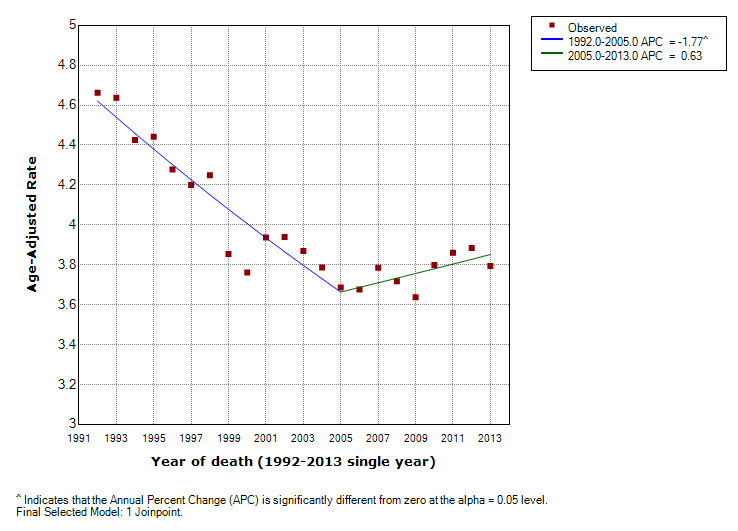
Figure 3. Comparability ratio model for White non-Hispanic Male US Mortality for Oral Cavity and Pharynx Cancers, 1992-2013. The comparability ratio (input from a double coding study) is 0.9603 with standard error = 0.0039.
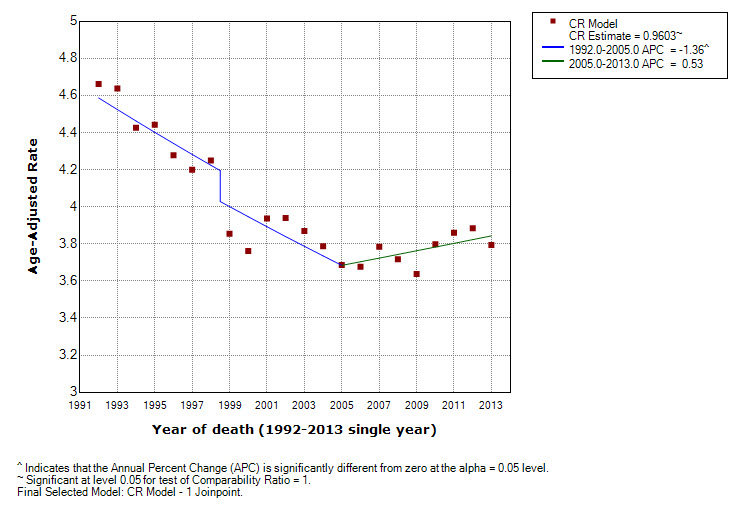
Figure 4. Jump model for White non-Hispanic Males US Mortality for Oral Cavity and Pharynx Cancers, 1992-2013. The estimate of the comparability ratio is 0.8844 with standard error = 0.0311.
- The underlying variability of the data may make estimation of a small or modest jump size impossible. In small sub-populations (e.g. API, AI/AN, rare cancer sites, or small geographic areas), such situations may occur. Since the jump is a parameter estimated in the jump model, a test can be conducted if the jump is statistically greater than zero. In cases where the jump size is insignificant, the comparability ratio model may be the better choice. Even in situations where the jump is statistically significant, if there is large variability, and the comparability ratio is small, one should be wary of estimates of the jump which differ widely from the comparability ratio.
- Fitting both models is usually a good idea. The "safer bet" is usually the comparability ratio model since the jump model can occasionally produce anomalous results. However, the jump model can offer better estimates if the double coding study was estimated from a limited range of years or from a population which differs from the data series being modeled. In many cases where the estimates from the two models are similar, the jump may be preferred.
- In cases where no double coding studies exist, one should be cautious in accepting the results of the jump model. The analyst should evaluate the size of the underlying variability of the data, and should be suspicious of joinpoint segments which start or end close to the jump location, and the slope of the segment seems to be "compensating" for the size of the jump.
In general, it is best to do a careful examination of the models using the criteria above before deciding which model to select. An algorithmic approach may be desired in the case of many data sequences to be analyzed. See Melanoma for an example of an algorithmic approach.
Display
The software allows viewing of a graph for each joinpoint model, from the model with the minimum number of joinpoints to the model with the maximum number of joinpoints. The graph will show a "jump" at the location where the coding change occurs. The software also allows for graphs of different models and/or cohorts to be combined.
Citation & Reference
- Chen HS, Zeichner S, Anderson RN, Espey DK, Kim HJ, Feuer EJ. The Joinpoint-Jump and Joinpoint-Comparability Ratio Model for Trend Analysis with Applications to Coding Changes in Health Statistics. J Off Stat. 2020;36(1):49-62. doi:10.2478/jos-2020-0003
- Anderson RN; Miniño AM, H.D.R.H., Comparability of Cause of Death Between ICD–9 and ICD–10: Preliminary Estimates. National Vital Statistics Reports, 2001. 49(2): p. 2001-1120.